Year 6 · Spring term · Statistics · Step 5
Year 6 Drawing pie charts worksheets
Work out angles and draw a pie chart. A free editable Word sheet with eight fluency and six reasoning questions. The answers follow the questions: the same sheet again with every answer in red.
Download the worksheets
Print on A4 portrait: every page carries the sheet twice, side by side, so you can cut down the middle and two pupils each get a half to stick in their books. Every question sits in its own box and pupils write their answers in their book. The answers follow the questions in the file: the same sheet again with every answer in red. It opens in Word, Google Docs, Pages and LibreOffice, so you can change numbers, delete questions or add your own. There is no scaffolded version of this step yet.
Not scaffolded sheet
The same questions without the extra support. For pupils working at the expected standard: eight fluency questions first, then the reasoning questions.
Sample questions from this step
These are real questions from the first set of the sheet (two from the fluency page, two from the reasoning page). Open each one to see the answer.
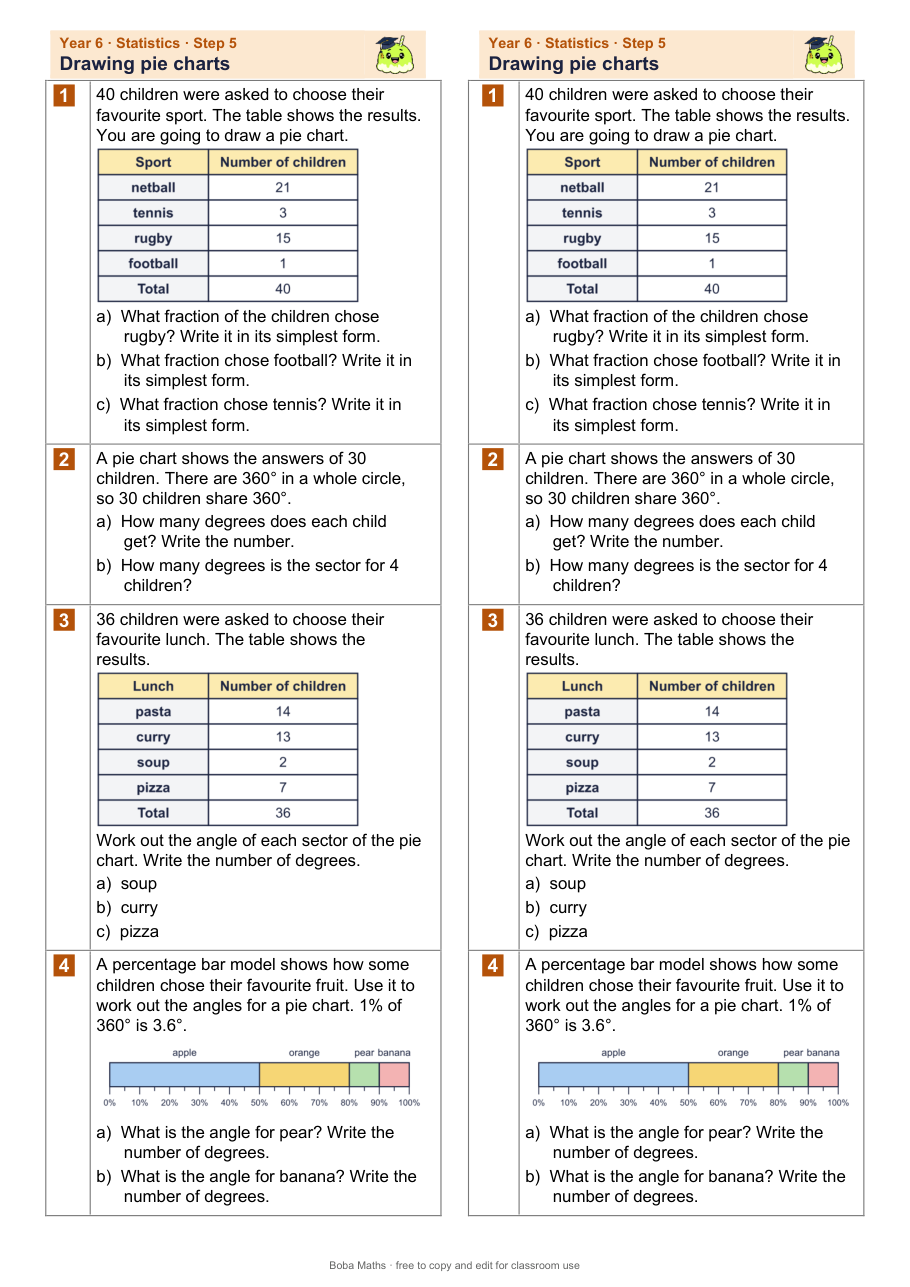
- 40 children were asked to choose their favourite sport. The table shows the results. You are going to draw a pie chart.a) What fraction of the children chose rugby? Write it in its simplest form. ____b) What fraction chose football? Write it in its simplest form. ____c) What fraction chose tennis? Write it in its simplest form. ____
Show the answer
3/8; 1/40; 3/40
- A percentage bar model shows how some children chose their favourite fruit. Use it to work out the angles for a pie chart. 1% of 360° is 3.6°.a) What is the angle for pear? Write the number of degrees. ____b) What is the angle for banana? Write the number of degrees. ____
Show the answer
36; 36
- There are 30 children in the survey and 6 of them chose tennis. So the angle for tennis is 60°.Is Boba correct? Circle yes or no.Circle yes or no.Explain how you know.
Show the answer
No; Each child is 360° ÷ 30 = 12°. So 6 children is 6 × 12° = 72°, not 60°.
- 40 people chose a meal at a restaurant. The table is for a pie chart. Some numbers are missing.a) How many people chose Vegan? Write the number. ____b) What is the angle for Fish? Write the number of degrees. ____
Show the answer
21; 36
What is on each sheet
- Fluency: eight questions that start easy and get harder, with the key skill of the step practised in different ways.
- Reasoning: questions with pictures, tables and number lines (spot the mistake, true or false and explain, puzzles with one answer, an open-ended task).
- Answers in the same file: the sheet again with every answer in red, so there is only one file to download.
- Boba characters give the instructions in speech bubbles. They are decoration only.
Why one set of questions?
- Everyone works on the same content, and support comes from scaffolds instead of different, easier tasks. This follows the mastery approach described by the NCETM and the thinking in Ofsted's 2021 mathematics research review.
- Worked examples and visual representations lighten the load for pupils who need it, as the Education Endowment Foundation describes.